
Power Testing
Power Profile
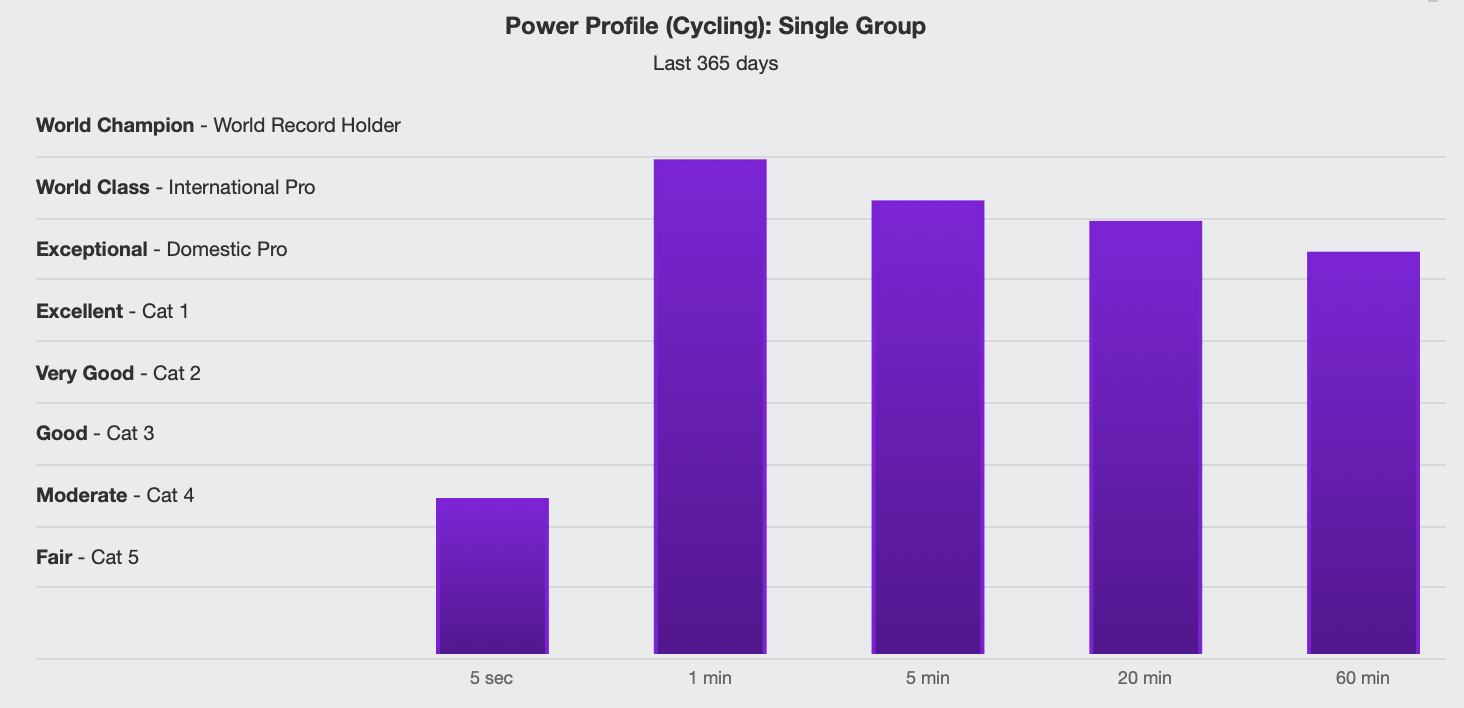
There are a couple of main ways to look at our fitness on the bike. One is our power profile. This takes our best power that we have ever produced and gives us some sort of rank. Here are a couple examples of how it looks on Trainingpeaks.

Rider A
Rider B
Rider A is a rock star and wins many races. She has category 1 anaerobic power. We know this based on her 5 second (ATP-PCr system) and 1 minute (glycolytic system) power (more on these energy systems to come). Based on her 20 and 60 minutes we see she has category 2 aerobic power. This means that it is very hard to drop her during and even harder to beat her at the end of the race. She usually wins races in the sprints and late race attacks.
Rider B has international level pro anaerobic one minute power and domestic pro level aerobic power. Her limiter is a category 4 - 5 second power. Rider B also wins many races but almost always when the course has a big steep climb. She also can make a great late race attack.
Our power profile will tell us some of our strengths and weaknesses. With this information we will know if and where we should attack and where we could be put into difficulty. We can also use it to guide our training and track progress.
Fatigue Resistance
Another way to judge our fitness is our fatigue resistance. Fatigue resistance can mean at least a couple different things. One example of this is comparing a road sprinter to a track sprinter. Who would you pick to win a race to the end of the block? I’d pick the velodrome sprinter because their legs are huge and their peak power is almost always higher. Who would you pick in a sprint to the end of the block after 100 miles of hard racing? Probably the road sprinter.
Fatigue resistance is the reason why rider B from above does win the occasional sprint. If the race is long and hard enough she will make it to the finish line with a lot more gas left in the tank compared to her competitors. Her category 4 sprint will win if everyone else’s sprint turns into a category 5 due to fatigue. So this is one way we can think about fatigue resistance. How long can you go for and how much effort can you put out before your power starts to drop?
Energy System Fatigue Resistance
Fatigue resistance can also look at how our own personal energy systems work. Here is a quick refresher of the three systems our body has to produce energy. The ATP-PCr and glycolytic systems are both anaerobic (do not use oxygen). The oxidative system is aerobic (uses oxygen). At any given moment all three systems are providing us with energy. As the intensity changes so does the percentage of input each energy system is providing. For example, the anaerobic and aerobic systems each provide about fifty percent of the energy when running a mile. Ninety eight percent of our energy comes from anaerobic metabolism during a 100 meter sprint. Ninety percent of our energy comes from aerobic metabolism during a marathon.
The ATP-PCr system provides us with energy for up to a good 10-15 seconds. After that the glycolytic system starts to take over more of the work load. The glycolytic system really shines from ~30-90 seconds but will provide us with the majority of our energy up to around a few minutes. After that our oxidative system provides the majority of our energy. Again, all three energy systems are always working together but the percentage of their input changes based on the duration of our effort/intensity we are working out at in the moment.
So we can say that there are two main energy systems in our body. They are anaerobic and aerobic. There is variation in our fatigue resistance in both systems from person to person. One fascinating example is between Usain Bolt and Wayde Van Niekerk. They are both world record holders with massive anaerobic systems. Check out Usain Bolt’s ranking of his fastest times for each distance on the track.
100 meters - fastest ever time - 9.58 seconds
200 meters - fastest ever time - 19.19 seconds
300 meters - 3rd fastest time ever - 30.97 seconds
400 meters - 588th fastest time ever - 45.28 seconds
This fascinates me so much because all of these races are (almost) purely anaerobic at 45 seconds or less. He dominated in the 100 and 200 meters but only (“only” haha of course I could only dream of running a lap in 45 seconds) managed the 588th fastest 400 meter time. When his glycolytic energy system took over as he approached 30+ seconds he was not as dominant.
Speaking of the glycolytic system Wayde Van Niekerk holds the fastest 400 meters of all time. He holds the 88th fastest 100 meter time. So we could assume Van Niekerk’s glycolytic system is a little better than his ATP-PCr system.
If these two were cyclists Usain Bolt’s 5 second maximum power (ATP-PCR system) would be much higher than Wayde Van Niekerk’s. However, we would say that Wayde’s anaerobic system fatigue resistance was superior. He wouldn’t have as high of a maximum 5 second power but his 45 second power would be much closer to his maximum power than Usain Bolt’s. If we were using this information in a bicycle race we would tell Bolt to stay on Van Niekerk’s wheel until the last moment and then out sprint him. Van Niekerk would need to find a moment Bolt was not drafting on his wheel to sprint long to the finish or find a hard place to attack earlier in the race to use his superior glycolytic system and anaerobic fatigue resistance ability.
This is also what we see between Rider A and Rider B from above.
Rider A - 30.6% drop in power from 5 to 30 seconds - but much higher 5 second power
Rider B - 15.4% drop in power from 5 to 30 seconds
In Summary
These are a couple ways we can look at our fitness. One is our power profile. How much power can we produce when we are fresh and ready? Another is our fatigue resistance. We can think about fatigue resistance as how much work we can do before our power starts to drop. We can also think about fatigue resistance as the drop off in power within each energy system.
So are we currently a short or long sprinter? Not a sprinter at all? Can we attack and sprint at the end of a race? Are we faster on flats or climbs? Where do we attack? Do we attack? How long of a hill do we look for to attack on? How far from the finish? There are many questions that can be answered by performing the following power tests. Of course we probably have a good idea about some of the answers if we have been riding and racing for some time. Even if that’s the case, the main benefit to these power tests is that they give us objective numbers and are repeatable. Even if we know what our limiters are on the bike how do we know if our training is actually improving them? By performing these power tests throughout the year and seeing if the numbers are changing.
There are so many ways and computer analysis tools to measure these things. Some are expensive and very complicated. I wanted to make a simple way to do this. This process is from Training and Racing With A Power Meter. Here you will find three training rides to plug into your Trainingpeaks. If you’re already my client send me a message and I will input them manually. If not, reach out for a discount on any of my Trainingpeaks training plans. Once completed you can input the data into this spreadsheet to look at your fatigue resistance. The power profile graph can be viewed with a premium Trainingpeaks account. If you don’t have one let me know and I can send you a copy. Of course I am here to help at least interpret the data. Let me know if you’re giving this a try!